What Is Inventory Turnover Ratio? Your 2026 SME Success Key

Inventory turnover ratio measures how many times your business sells and replaces its stock over a period, and the basic formula is COGS ÷ average inventory. A practical way to read it is through days sales of inventory, or DSI = 365 ÷ turnover, which tells you how long stock is sitting before it turns into sales.
If you're running a wholesale business, electronics distributorship, or dealership in the UAE, you may already know the feeling. Your shelves are full. Your warehouse looks valuable. But when it's time to pay suppliers, cover salaries, or place the next order, cash feels tight.
That gap is where many owners get confused. They assume stock is the same as liquidity. It isn't. Stock becomes useful only when it moves.
Inventory turnover ratio helps you see that movement clearly. It turns a vague sense of “we have too much inventory” into a measurable operational signal. And for MENA SMEs, that matters because improving turnover isn't just about tidier stock control. It's one of the cleanest ways to free up cash already trapped inside the business.
Why Your Stockroom Is Full but Your Bank Account Is Empty
A lot of SME owners hit the same wall. Sales look decent on paper, the warehouse is busy, staff are picking and packing, yet the business still feels under pressure every month.
The reason is simple. Inventory absorbs cash before it creates cash.
A distributor buys goods, stores them, insures them, moves them, and waits. During that waiting period, the money spent on that stock isn't available for anything else. It can't be used for payroll, supplier payments, promotions, repairs, or a new product line. It's sitting on a shelf in the form of products.
The hidden trap in “valuable stock”
Let's take a familiar example. A retailer may look around the storeroom and think, “We're well stocked.” A finance manager often sees something different: cash tied up in items that haven't moved in weeks, or months.
That's why inventory turnover ratio matters. It answers a very practical question:
How efficiently are you turning stock into sales, and then back into cash?
If the answer is “slowly”, your business can feel busy without feeling liquid. That's a dangerous combination, especially in sectors where product cycles move fast or where buyers expect immediate availability.
Why this metric matters more than many owners realise
This ratio isn't just for accountants. It helps owners make better day-to-day decisions, such as:
- What to reorder: Which products deserve more shelf space because they move
- What to stop buying: Which lines consume cash without giving enough back
- What to watch more closely: Which categories look fine at company level but are dragging performance underneath
A business can grow revenue and still create stress if inventory grows faster than sales. That's why experienced operators don't just ask, “How much stock do we have?” They ask, “How quickly is it moving?”
Once you start tracking inventory turnover properly, your stockroom stops being a static pile of goods and starts behaving like a flow system. That shift changes how you buy, sell, and plan.
Defining the Inventory Turnover Ratio in Simple Terms
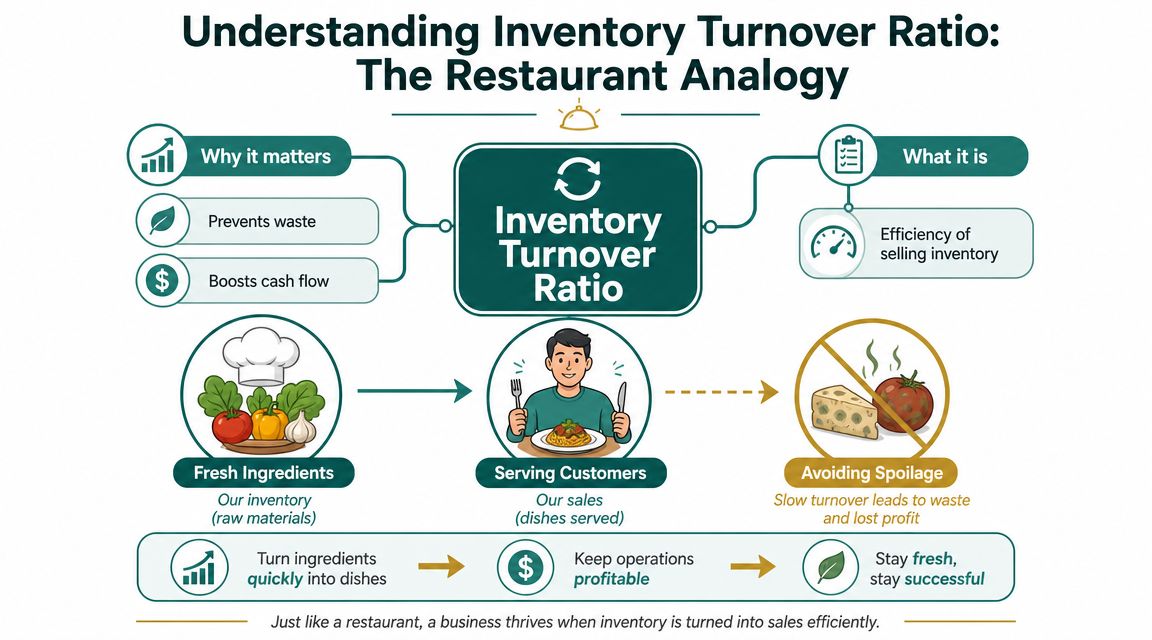
A simple way to understand what inventory turnover ratio is is to think about a busy restaurant. A strong restaurant doesn't make money because it owns a lot of tables. It makes money because it seats guests, serves them, clears the tables, and seats the next group.
Your inventory works the same way.
Think of stock like tables in a restaurant
If a table stays occupied for too long without generating enough sales, the restaurant loses opportunities. If ingredients sit too long, they spoil, tie up cash, and create waste. Good operators watch flow, not just quantity.
Inventory turnover ratio is the business version of that flow check. It shows how many times you sell through and replace your stock during a period.
If your stock turns regularly, cash keeps moving through the business. If it doesn't, money gets stuck.
Practical rule: Don't think of inventory as “assets on shelves”. Think of it as cash waiting to be released.
The two pieces behind the ratio
It's common to get nervous when hearing formula language, but the building blocks are straightforward.
COGS, or cost of goods sold, is the direct cost of the items you sold during the period. For a distributor, that usually means the purchase cost of the stock that went out the door. For a manufacturer, it includes the direct production cost of what was sold.
Average inventory is the typical amount of stock you held during the period. It matters because inventory levels rise and fall. Looking at only one date can give you a distorted view.
Here's the plain-English version:
- COGS asks: How much stock value did you sell?
- Average inventory asks: How much stock were you carrying while making those sales?
The turnover ratio compares those two.
What the ratio is really telling you
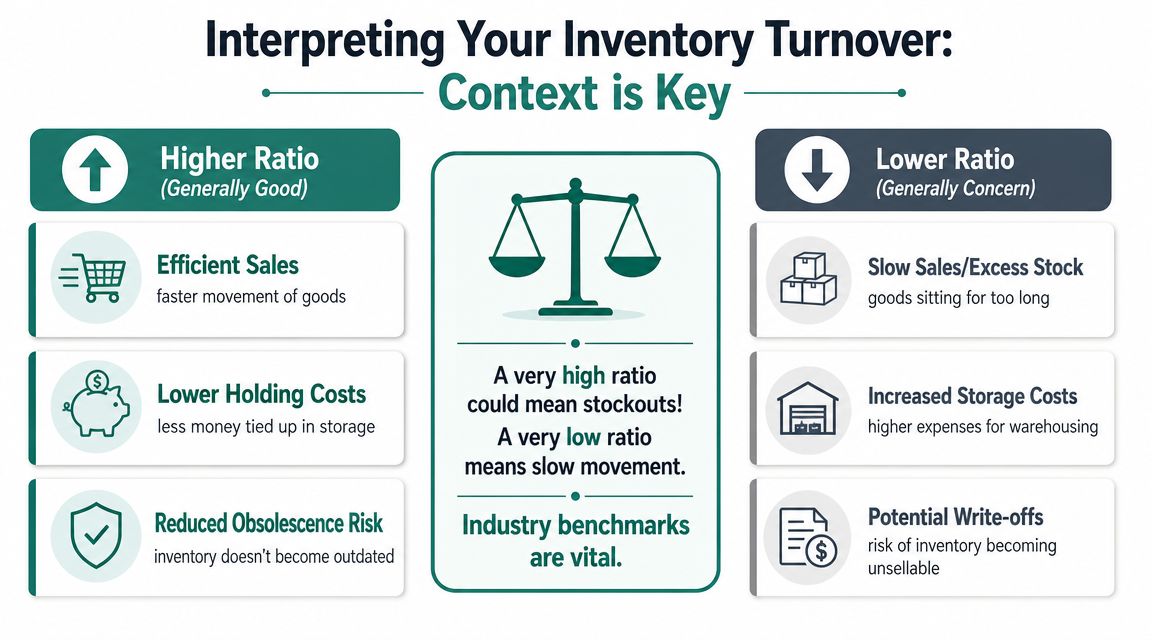
A higher ratio usually means stock is moving more quickly. A lower ratio usually means products are staying on hand for longer.
That sounds obvious, but here's where owners often slip. They look only at sales volume. Inventory turnover asks a sharper question: How much inventory did you need to hold to generate those sales?
That's why two businesses with similar sales can have very different cash positions. One may be running a tight, organised stock operation. The other may be carrying too much slow-moving inventory.
When you understand the ratio this way, it stops being an accounting term and becomes an operating habit. You're not only counting products. You're measuring how efficiently the business converts stock into usable cash.
How to Calculate Your Inventory Turnover Ratio Step by Step
The formal calculation is straightforward: inventory turnover ratio = COGS ÷ average inventory, and the practical companion metric is DSI = 365 ÷ turnover according to Allianz Trade's explanation of inventory turnover ratio. The same source notes that 5–10x is commonly cited as healthy for many industries, which implies roughly 36–73 days of inventory on hand, though the right benchmark depends on category velocity, lead times, and service levels.
That last point matters. A company-wide average can hide a lot. In wholesale, electronics distribution, and vehicle sales, the real insight often appears when you track turnover by SKU or category, not just for the whole business.
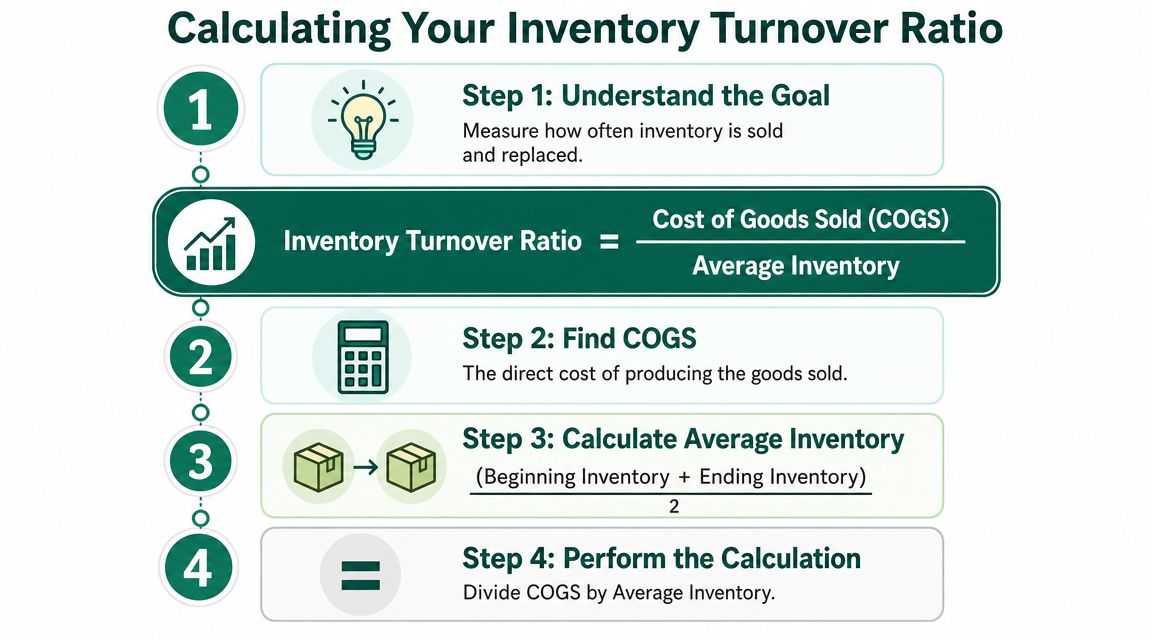
The formula without the jargon
You only need two numbers:
- COGS
- Average inventory
Then divide the first by the second.
The confusion usually comes from where those numbers come from, not from the maths itself.
Where to find each input
For most SMEs, you can pull this from your accounts and inventory records.
- COGS: This usually comes from your income statement or profit and loss report. If you want a more detailed explanation of what belongs inside that figure, this complete guide to calculating COGS is a useful reference.
- Beginning inventory: The value of your stock at the start of the period.
- Ending inventory: The value of your stock at the end of the period.
- Average inventory: Add beginning inventory and ending inventory, then divide by two.
In simple terms:
- Take the stock value at the start.
- Take the stock value at the end.
- Average them.
- Divide COGS by that average.
A plain-language example
Say you're an electronics distributor in the UAE. Over the year, you sell laptops, accessories, and networking equipment.
You review your reports and calculate your average inventory for the period. You also pull your COGS from the same reporting period. Once you divide COGS by average inventory, you get your turnover ratio.
If the result is high, those products are moving through the business relatively quickly. If the result is low, more cash is sitting in stock for longer.
The exact number matters less than using the same method consistently. That way, you can compare one quarter with another, or one category with another.
Turn the ratio into days
This is the part many non-finance owners find more useful. Instead of asking, “How many times did I turn my stock?”, ask:
How many days does inventory sit before it moves?
That's what days sales of inventory gives you:
- DSI = 365 ÷ turnover ratio
For operations teams, DSI is often easier to act on. A buyer can understand “this line sits too long” much faster than “this category turns too slowly”.
If your ratio feels abstract, convert it into days. People manage calendars more easily than ratios.
This is also why category-level tracking is powerful. A company average may look acceptable while one product family is absorbing too much cash. The business appears healthy at the top line, but one slow-moving segment is subtly putting pressure on purchasing and cash planning.
Interpreting Your Ratio What Is a Good Number
The most common mistake with this metric is assuming that a higher number is always better. It isn't.
A strong turnover ratio depends on what you sell, your margins, your lead times, your seasonality, and how profitable each SKU really is. That broader context is exactly what Extensiv's discussion of a good inventory turnover ratio highlights. For UAE SMEs in retail, distribution, and automotive, that's especially important because demand can shift sharply across the year.
Why “good” depends on your business model
A low-margin distributor usually needs inventory to move faster. The margin on each sale is thinner, so cash needs to come back quickly.
A business selling higher-margin, slower-moving items may accept a lower ratio if each sale is still worthwhile. That doesn't automatically mean the stock is unhealthy. It may reflect the economics of the category.
Seasonality complicates this further. A single annual figure can make a seasonal business look clumsy even when it is well run. If you buy ahead of a peak season, inventory will look heavy before demand catches up.
When a higher ratio can be a warning sign
A high ratio can look impressive, but it can also mean:
- Stockouts are creeping in: You're selling faster than you replenish
- Customers may be waiting: Lost availability can damage service levels
- The business is under-buying: The ratio rises, but sales opportunities may be slipping away
That's why finance and operations need to read the number together. A ratio on its own never tells the whole story.
A ratio is a signal, not a verdict.
Use clean data before you trust the answer
Many turnover problems are really data problems in disguise. Product names are duplicated, categories are inconsistent, or slow-moving SKUs are grouped with fast-moving ones. If the underlying item data is messy, the ratio may point you in the wrong direction.
That's where work on catalogue structure and reporting discipline matters. If your inventory data is fragmented across systems, mastering data excellence is a useful place to sharpen how you think about data quality before acting on the metric.
This also pairs well with related collection and liquidity metrics. If you want to see how stock movement connects with customer payment speed, this guide to the accounts receivable turnover ratio helps complete the picture.
The Impact on Your Business Cash Flow and Profitability
Slow-moving inventory doesn't just take up shelf space. It puts pressure on the whole business.
When stock sits too long, cash is locked inside goods that haven't yet produced a return. Meanwhile, your actual expenses keep moving. Rent is due. Salaries are due. Suppliers expect payment. Marketing needs budget. The longer inventory stays idle, the harder it is to keep that cycle comfortable.
Why slow stock hurts more than most owners expect
Holding inventory comes with costs that are easy to underestimate:
- Storage costs: Warehouse space, handling, and organisation
- Protection costs: Insurance, shrinkage control, and damaged goods
- Operational drag: Staff time spent counting, moving, and managing products that aren't selling
- Obsolescence risk: Especially in electronics and trend-sensitive categories
Even when stock is still technically saleable, it may be absorbing management attention and cash that would be better used elsewhere.
The automotive example makes this very clear
This issue is especially visible in vehicle sales. In the UAE automotive channel, stock can sit up to 180 days, which works out to roughly 2.0x turnover per year if inventory is fully replaced once every 180 days, as explained in Logimax's overview of inventory turnover ratio. That low turnover increases pressure because capital stays tied up in slow-moving inventory, limiting restocking capacity and deal volume.
For an owner, that means the showroom may look full while flexibility keeps shrinking.
A dealer with too much aging stock has less room to respond to demand. The same logic applies to wholesalers carrying the wrong product mix. Capital is present in the business, but it isn't available.
Why faster movement strengthens resilience
When inventory turns faster, the business shortens the gap between spending cash and getting cash back. That improves day-to-day flexibility.
It also makes planning easier. You can place orders with more confidence, react to demand faster, and reduce the chance that one slow category drags down the rest of the operation.
If you want a broader way to connect inventory with receivables and payables, this guide to the cash conversion cycle is worth reading. Inventory turnover sits right in the middle of that wider liquidity story.
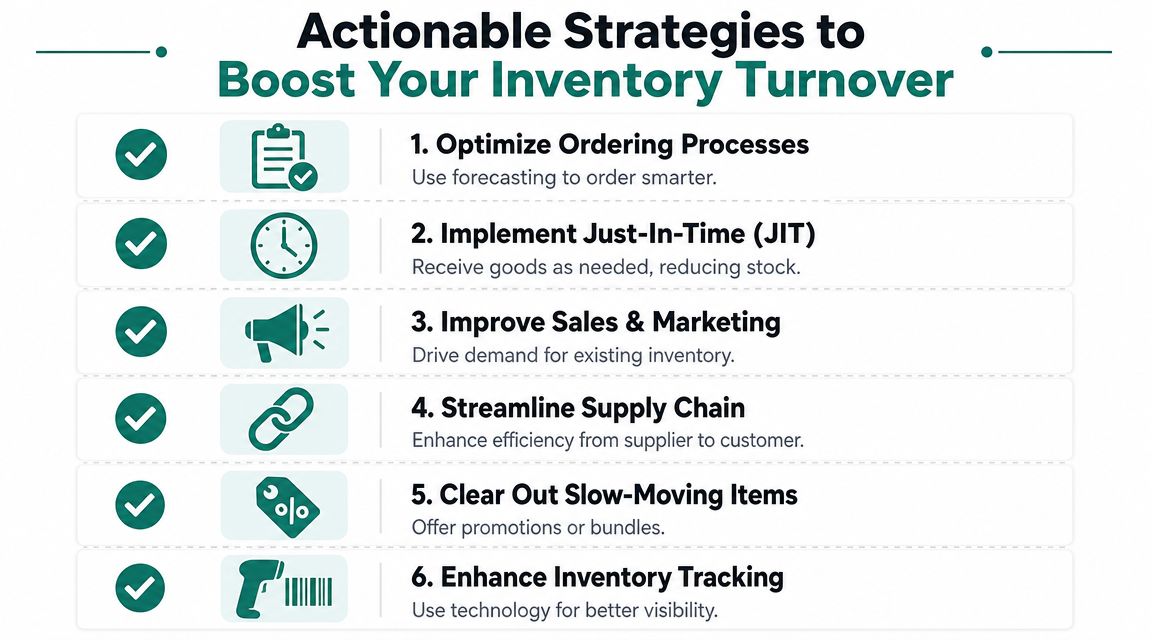
Actionable Strategies to Improve Your Inventory Turnover
Most businesses don't improve turnover with one dramatic fix. They improve it by tightening a handful of operating habits.
The goal isn't to chase the highest possible ratio. The goal is to make sure your stock profile matches real demand, lead times, and margins.
Start with visibility
If you can't see which items move fast and which ones stall, you can't improve the ratio in a meaningful way.
- Track by category first: If SKU-level analysis feels too heavy, begin with product families. This usually reveals obvious problem areas quickly.
- Separate fast and slow movers: Don't let one strong line hide a pile of aging stock.
- Review DSI regularly: Days often trigger faster action than ratios.
Tighten buying decisions
A lot of turnover issues begin at the purchasing stage, not in sales.
- Use observed sell-through, not habit: Buyers often reorder because “we always stock this”. Replace that with actual movement.
- Reduce order sizes where possible: Smaller, better-timed purchases can keep stock leaner.
- Shorten replenishment cycles: If suppliers can deliver more frequently, you may not need to hold as much.
Clear stock that no longer deserves the cash
Many owners keep slow stock too long because they don't want to accept a lower selling price. That can be an expensive form of hesitation.
Old stock doesn't become more valuable because you wait.
Practical ways to deal with it:
- Bundle lagging items: Pair them with stronger sellers
- Discount selectively: Recover cash and free space
- Stop automatic reordering: A slow seller shouldn't keep renewing itself
- Create an ageing review: Give responsibility to one person, not everyone vaguely
Improve forecasting without overcomplicating it
Forecasting doesn't need to be fancy to be useful.
- Look at sales history: Start with what moved last period
- Adjust for seasonality: If your demand spikes by quarter, your purchasing should reflect that
- Bring sales and finance together: Sales teams know demand patterns. Finance sees the cash pressure. Both views matter.
For businesses operating in the region, this also connects with broader inventory planning decisions. If you're looking at stock strategy in a UAE SME context, this article on inventory planning for UAE businesses adds useful commercial context around how stock choices affect growth.
How Comfi Helps You Optimize Inventory Metrics
Knowing your turnover ratio is useful. Acting on it often comes down to timing, liquidity, and operational control.
For example, a dealer with vehicles sitting on the floor for long periods may need a way to release the cash tied up in existing stock so they can restock faster and respond to demand more effectively. A supplier waiting on invoice payment may need faster access to cash so inventory decisions aren't held back by delayed collections. A buyer may want more flexibility to align stock purchases with the pace of actual sales.
Comfi supports those moments with products like Automotive Dealer Financing. The practical outcome is that clients can free up working capital tied up in operations and manage inventory metrics with more flexibility, without treating stock planning as a separate finance problem.
If you're looking for a more flexible way to manage stock cycles, free up working capital, and reduce cash-flow pressure as inventory moves through your business, explore Comfi.